Graphing Program
Advertisement
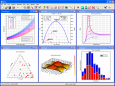
DPlot
DPlot is a general purpose graphing program designed for scientists, engineers, and students. It features multiple scaling types, including linear, logarithmic, and probability scales, as well as several special purpose XY graphs and contour plots of 3D
Advertisement

GraphSight Junior v.1.0
GraphSight Junior is an easy to use freeware handy 2D math-graphing program. It was originally designed to help students and teachers satisfy their day-after-day math plotting needs.
XPlotter v.4.0
Xplotter is a general purpose scientific graphing program for Windows. A wide variety of options allow the graphs to be customized to your requirements.
FX Graph v.4.001.7
A simple, easy-to-use, but strong, graphing program. FX Graph is Powerful Graphing Made Dead Simple. Most graphing packages offer strong features but they are difficult to learn, difficult to teach and difficult to use.
NAMD Log Parser v.1.1
NAMD Log Parser is a GUI-based Java software that sorts through the log file generated by NAMD and extracts energy information to export to a graphing program. The data is exported as a tab-delimited text file with a CSV extension.
Xmgrace python interface v.2.01
This is a python module providing a nearly complete interface to the graphing program xmgrace.
MagicPlot Student v.2.3
MagicPlot is an easy to use program for scientific and engineering data analysis, graphing and nonlinear curve fitting. MagicPlot provides publication-quality graphs. It is fast, lightweight and does not need installation.
MagicPlot Calculator v.1.1
MagicPlot Calculator is a simple and easy-to-use formula calculator. MagicPlot Calculator is a free expression calculator from MagicPlot graphing application. Even if you don't use MagicPlot you can use our strong calculator.
PSI-Plot v.9.01.0009
PSI-Plot brings flexibility to technical plotting and data analysis. It has a powerful scientific spreadsheet for data analysis, and an object-oriented on screen graphics editor that makes it easy to design and modify graphs.
100 Million Count v.1.0
100 Million Count tracks and records the number of iTMS songs purchased by checking Apple's website (which is refreshed every 5 minutes).
Graph Sketcher v.1.5.2
Graph Sketcher lets you make elegant and precise graphs in seconds, simply by sketching what you want.